
Morse - O - Tool
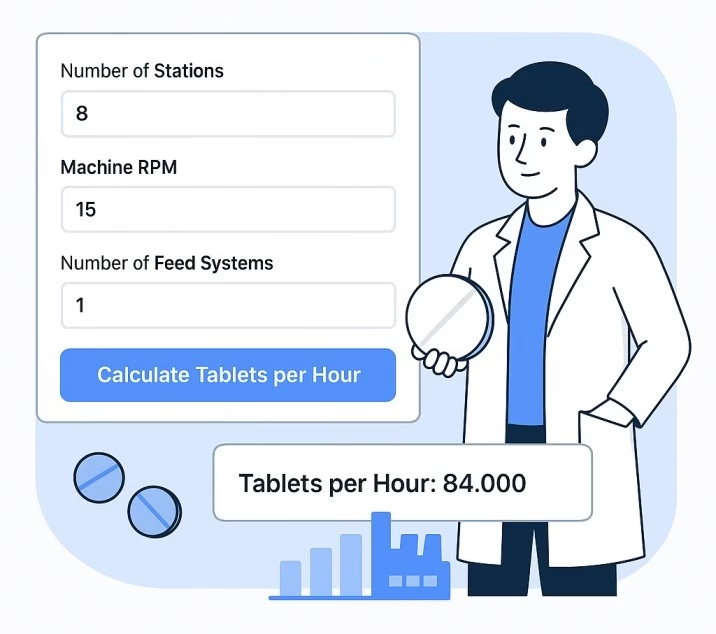
Tablet Compressed Per Hour Calculator
Time Required to Compress Tablets
Estimates output with machine precision
Supports batch planning & QA validation
Works seamlessly on mobile & desktop
Great for R&D and pilot-scale calculations
Saves time by eliminating manual formulas
No login required, instant results
Revolutionize Your Pharmaceutical Manufacturing: The Ultimate Tablet Compressed Per Hour Calculator Tool
Transform your tablet production planning with precision calculations that save time, reduce costs, and optimize manufacturing efficiency. Our free tablet compression calculator eliminates manual calculations and provides instant results for production planning across R&D, pilot-scale, and full production operations.
Why Pharmaceutical Production Planning Matters More Than Ever
The pharmaceutical industry operates under unprecedented pressure. With global demand for medications continuously rising and regulatory requirements becoming increasingly stringent, manufacturers face a critical challenge: how to maximize production efficiency while maintaining the highest quality standards.
The baseline pharmaceutical tablet processes require 170 h and consume 5600 kWh for one tables’ manufacturing batch. Process optimization can lead to significant improvements – studies show time reduction of approximately 71% was attained, and the reduction in GHG emissions and energy cost were 73.2%.
Modern tablet compression represents one of the most energy-intensive processes in pharmaceutical manufacturing, with the tablet segment leads the solid dosage form market by controlling more than 50% of global pharmaceutical production. Getting production calculations right from the start isn’t just about efficiency – it’s about competitive survival.

Introducing the Game-Changing Tablet Compressed Per Hour Calculator
The Morse-O-Tool Tablet Compression Calculator represents a breakthrough in pharmaceutical production planning technology. This precision-engineered tool transforms complex production calculations into instant, accurate results.
⚙️ Machine Precision Estimates
Generate output calculations with the same precision as your production equipment. The calculator accounts for real-world variables that affect tablet press performance, providing estimates that align with actual manufacturing conditions.
📈 Batch Planning & QA Validation Support
Streamline your production planning process with built-in validation features. The tool supports both small-batch R&D calculations and large-scale production planning, ensuring consistency across your entire manufacturing pipeline.
📱 Mobile & Desktop Optimization
Access your calculations anywhere, anytime. Whether you’re on the production floor reviewing equipment performance or in a boardroom presenting capacity analysis, the responsive design ensures seamless functionality across all devices.
🧪 R&D to Production Scale Support
Bridge the gap between laboratory development and full-scale manufacturing. The calculator handles everything from prototype batches to industrial-scale production runs, supporting the entire product lifecycle.
⏰ Eliminate Manual Formula Dependencies
Stop wasting valuable engineering time on repetitive calculations. What previously took hours of spreadsheet work now takes seconds, freeing your team to focus on process optimization and innovation.
🔒 Instant Results, No Login Required
Get immediate answers without bureaucratic barriers. No account setup, no data tracking, no corporate approval processes – just instant, accurate calculations when you need them.
The Science Behind Tablet Compression Efficiency
Understanding Production Capacity Fundamentals
Modern tablet compression operates on precise mathematical relationships. For all tablet press designs, the at any given press speed, the output is calculated by
Equation 1: Output (tablets/hour) = Press speed (revolutions/min) x Number of punch stations x 60 min/h
However, real-world production involves numerous variables that affect this baseline calculation:
Turret Configuration Impact: If the same tablet is produced at the same press speed with a 47 station TSM BBS turret, the output becomes 225,600 tablets per hour: an increase of 34%.
Multi-Tip Technology: Advanced tooling can dramatically increase output. Using a 5-tip tool configuration on the 59-station turret would achieve an output as follows: Output = 60 rev/min x 59 x 5 x 60 min/h = 1,062,000 tablets/h.
Process Capability and Quality Control
Production speed optimization must balance throughput with quality. Process capability values of 1.33 or 1.50, or higher, are generally indicative of a process that is under control, and process capability indices of greater than 2.0 would suggest that an increased press speed is possible while maintaining process quality.
Yield Optimization Factors
Most modern pharmaceutical manufacturers using state-of-the-art tablet presses will look to achieve final yields as high as 99% for single-layer tablets. Multi-layer yields are more challenging, given the number of different variables involved, with realistic figures often dipping closer to 85%.

Real-World Applications Across Pharmaceutical Manufacturing
Research & Development
Formulation optimization: Calculate material requirements for experimental batches
Scale-up planning: Predict production capacity needs before equipment investment
Process validation: Generate data for regulatory submissions
Pilot-Scale Operations
Batch scheduling: Optimize equipment utilization across multiple products
Resource planning: Accurate material ordering and waste reduction
Capacity analysis: Determine bottlenecks before full-scale production
Full Production Manufacturing
Production scheduling: Maximize throughput while maintaining quality standards
Equipment planning: Justify capital expenditure with precise capacity calculations
Operational efficiency: Identify optimization opportunities across product portfolios
Contract Manufacturing (CMO/CDMO)
Client proposals: Provide accurate timeline and capacity estimates
Resource allocation: Optimize facility utilization across multiple clients
Competitive bidding: Precise cost calculations for tender responses

Real-World Applications Across Pharmaceutical Manufacturing
Industry-Specific Benefits by Sector
Large Pharmaceutical Companies
Multi-site coordination: Standardize calculations across global manufacturing networks
Regulatory compliance: Generate consistent documentation for FDA and EMA submissions
Cost optimization: Identify the most efficient production configurations
Generic Drug Manufacturers
High-volume efficiency: Maximize output for cost-competitive products
Equipment ROI: Optimize existing press utilization before new investments
Market responsiveness: Quick capacity assessments for new product launches
Specialty Pharmaceutical Companies
Small-batch precision: Accurate calculations for orphan drugs and specialized formulations
Development efficiency: Streamline R&D to production transitions
Regulatory strategy: Support documentation with precise manufacturing data
Nutraceutical Manufacturers
Dietary supplement production: Calculate capacity for seasonal demand variations
Private label operations: Quick turnaround estimates for client proposals
Quality consistency: Maintain standards across diverse product lines